CALGARY, ALBERTA--(Marketwired - Aug. 2, 2017) - DIRTT Environmental Solutions Ltd. ("DIRTT" or the "Company") (TSX:DRT) today announced its financial results for the three- and six-month periods ended June 30, 2017. DIRTT uses technology to design and manufacture mass-custom interior construction projects. This news release contains references to Canadian dollars and United States dollars. Canadian dollars are referred to as "$" and United States dollars are referred to as "US$".
Select 2017 Q2 Highlights
For the three months ended June 30, 2017:
- Revenue increased by $8.8 million, or 14.3% over Q2 2016, to $70.0 million;
- Scope of contract announced April 25, 2017 increased from approximately US$5.0 million to US$32.7 million;
- Culmination of the largest DIRTT Connext yet (annual two-week sales, marketing and industry event) with overall sales partner attendance up 15% year over year;
- Gross profit increased by $2.5 million, or 9.3% over Q2 2016, to $29.9 million;
- Gross profit % decreased 190 basis points from Q2 2016 from 44.6% to 42.7%;
- Adjusted gross profit of $30.7 million and adjusted gross profit % of 43.9%;
- DIRTT Connext cost increased slightly by $0.1 million over Q2 2016, to $3.5 million;
- Incurred severance and restructuring costs of $0.8 million;
- Adjusted EBITDA of $2.1 million and adjusted EBITDA % of 3.0%; and
- Net loss was $2.9 million and net loss per share was $0.03.
For the six months ended June 30, 2017:
- Revenue increased by $17.9 million, or 15.3% over year-to-date ("YTD") 2016, to $135.1 million;
- Trailing 12-month revenue was $284.9 million versus $ 244.2 million in the prior 12- month period, an increase of 16.7%;
- Gross profit increased by $5.5 million, or 10.6% over YTD 2016, to $56.9 million;
- Gross profit % decreased 180 basis points from YTD 2016 from 43.9% to 42.1%;
- Adjusted gross profit of $58.6 million and adjusted gross profit % of 43.4%;
- Incurred severance and restructuring costs of $0.9 million;
- Adjusted EBITDA of $6.1 million and adjusted EBITDA % of 4.5%;
- Net loss was $4.3 million and net loss per share was $0.05; and
- Sales and marketing and business development headcount increased by 18.4% over Q2 2016 to 116.
"Our sales, marketing and business development investments over the past year are starting to pay off and I expect continued topline growth throughout the remainder of 2017," says DIRTT CEO Mogens Smed. Smed cites the scope increase of DIRTT's recently announced contract with a Fortune 100 company as reiteration of its value prop for clients. "Our recent project agreement for a Fortune 100 client has grown from 17 project locations to 66, two thirds of which are slated for completion in the latter half of 2017 and through 2018." There is opportunity for continued growth beyond the current scope.
DIRTT President Scott Jenkins adds that all vertical markets are demonstrating ongoing momentum as the second half of 2017 begins, particularly in healthcare. "DIRTT's healthcare revenue growth continues to outpace other vertical markets and we've added resources to address this opportunity," says Jenkins. "We expect to see an increase in projects from our growing list of healthcare clients in the United States and, in particular, the Middle East."
Adds Smed, "Conventional construction costs in North America continue to climb and access to skilled labor is still one of the largest challenges for many of our new and existing customers. DIRTT responds to both of these and remains committed to making the appropriate long-term investments as we capitalize on the market opportunity."
Update on Significant Contract
On April 25, 2017 DIRTT announced the award of a Fortune 100 company's multi-location project contract worth approximately US$5 million. The original scope involved 17 locations and DIRTT's full suite of solutions (walls, power, data, millwork and other). The client cited DIRTT's technology-backed ability to meet the custom interior requirements quickly and with cost certainty as determining factors in choosing DIRTT. As of July 2, 2017, the scope has grown to include 66 locations, valued at US$32.7 million (in excess of $40.0 million), the majority of which we expect to recognize over the latter half of 2017 and throughout 2018. In anticipation of this significant increase, DIRTT added dedicated resources and transitioned key team members to work exclusively on this contract's projects. This has added to our SG&A costs in the short term but is a critical investment; there exists an ongoing opportunity for a continued scope increase of this contract.
Summary Financial Results
| Q2 | Q2 | Q2 YTD | Q2 YTD | |
| ($ thousands, except per share amounts) | 2017 | 2016 | 2017 | 2016 |
| Revenue | 70,006 | 61,252 | 135,065 | 117,175 |
| Gross profit | 29,868 | 27,327 | 56,853 | 51,393 |
| Gross profit % | 42.7% | 44.6% | 42.1% | 43.9% |
| Adjusted gross profit (1) | 30,701 | 28,226 | 58,577 | 53,035 |
| Adjusted gross profit % (1) | 43.9% | 46.1% | 43.4% | 45.3% |
| Selling, general and administrative ("SG&A") | 32,925 | 27,543 | 60,908 | 50,689 |
| SG&A as a % of revenue | 47.0% | 45.0% | 45.1% | 43.3% |
| Adjusted SG&A (1) | 28,301 | 23,566 | 51,880 | 42,815 |
| Adjusted SG&A as a % of revenue (1) | 40.4% | 38.5% | 38.4% | 36.5% |
| Operating (loss) income | (3,057) | (216) | (4,055) | 704 |
| Adjusted EBITDA (1) | 2,131 | 4,385 | 6,140 | 8,963 |
| Adjusted EBITDA as % of revenue (1) | 3.0% | 7.2% | 4.5% | 7.6% |
| Income tax (recovery) expense | (245) | 987 | 92 | 958 |
| Net loss | (2,877) | (1,458) | (4,272) | (1,090) |
| Net loss per share - basic and diluted | (0.03) | (0.02) | (0.05) | (0.01) |
| Cash flows provided by operating activities | (613) | 13,668 | 4,012 | 14,936 |
| Cash flows provided by operating activities (1) before changes in non-cash working capital | 108 | 3,804 | 4,369 | 6,486 |
| As at | June 30, 2017 | December 31, 2016 | ||
| Cash and cash equivalents | 77,944 | 93,554 | ||
| Working capital | 96,880 | 112,590 | ||
| Long-term debt | 16,077 | 18,760 | ||
| Note: (1) See "Non-IFRS Measures". | ||||
Revenue
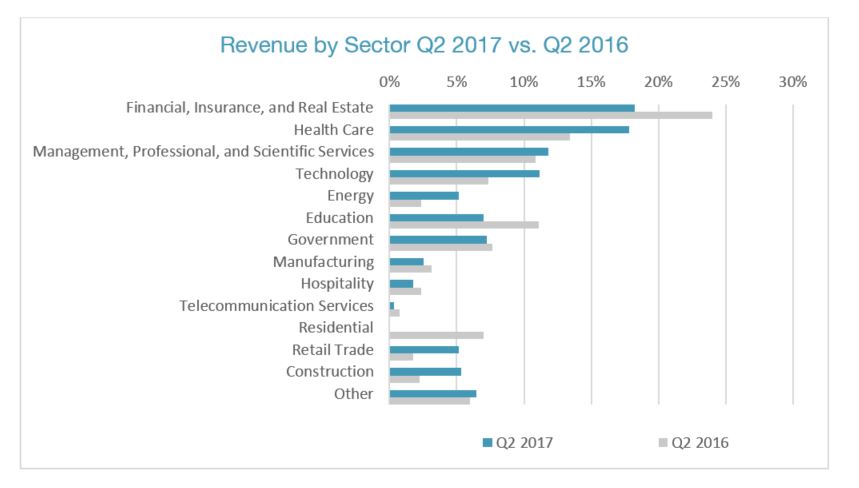
Revenue for Q2 2017 increased by $8.8 million (14.3%) over Q2 2016. This increase is attributable to a general increase in activity from small and medium-sized projects across a range of industry segments, including: healthcare, which increased from 13% of total revenue in Q2 2016 to 18% of total revenue in Q2 2017; technology, which increased from 7% of total revenue in Q2 2016 to 11% in Q2 2017; and energy and retail trade, each of which increased from 2% of total revenue in Q2 2016 to 5% in Q2 2017. In addition, the Company recorded installations revenue in Q2 2017 of $2.0 million compared with $0.3 million in Q2 2016.
The majority of our revenue is collected in US dollars, whereas our reporting currency is Canadian dollars. The resulting fluctuations in the US dollar against the Canadian dollar may have a positive or negative impact on our revenue. The US dollar (average rate) increased from 1.2882 in Q2 2016 to 1.3449 in Q2 2017, resulting in a positive impact on overall revenue in the period, as compared to the same quarter in 2016.
The growth in installation revenue is attributable to specific projects, such as the previously discussed major contract where DIRTT has decided it is important to work closely with our Partners to ensure consistency and on certain projects where 3rd party installation estimates were unrealistic to DIRTT and our customers. This revenue is not expected to grow materially as a percentage of revenue in future periods. This revenue does have a lower gross margin associated with it, as discussed under "Gross Profit".
To view the chart associated with this release, please visit the following link: http://media3.marketwire.com/docs/1100255_chart1.JPG
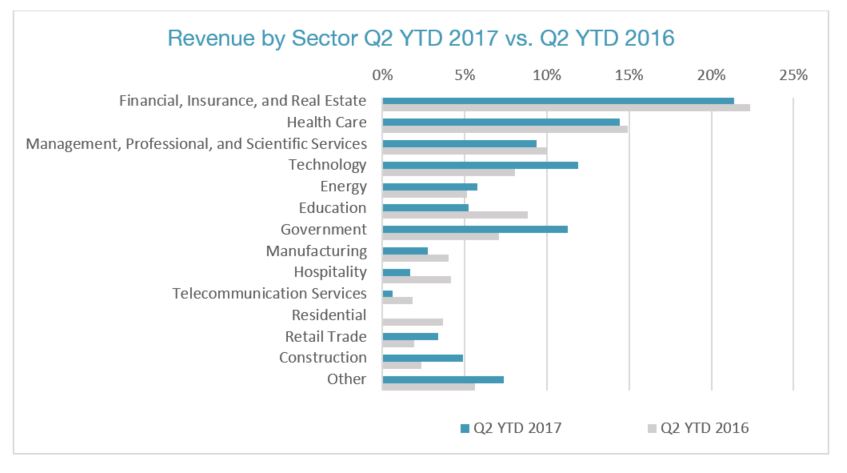
Revenue for YTD 2017 increased by $17.9 million (15.3%) over YTD 2016. This increase is attributable to a general increase in activity from small and medium-sized projects across a range of industry segments, including: technology, which increased from 8% of total revenue in YTD 2016 to 12% in YTD 2017; and government, which increased from 7% of total revenue in YTD 2016 to 11% in YTD 2017. In addition, the Company recorded installations revenue in YTD 2017 of $4.8 million compared with $0.4 million in YTD 2016.
The US dollar average exchange rate was essentially flat, increasing from 1.3297 in year-to-date (YTD) 2016 to 1.3343 in YTD 2017. The resulting impact to the Canadian dollar value of US revenue for YTD 2017 was negligible. As a result of the current weakness of the US dollar versus the Canadian dollar, we expect some negative effects on revenue growth for the second half of the year but cannot quantify the impact at this time. The effect on gross profit and EBITDA is expected to be of lesser significance, as a substantial portion of DIRTT's costs are USD denominated.
To view the chart associated with this release, please visit the following link: http://media3.marketwire.com/docs/1100255_chart2.JPG
Gross Profit / Adjusted Gross Profit / Gross Profit % / Adjusted Gross Profit %
Gross profit increased from $27.3 million in Q2 2016 to $29.9 million in Q2 2017, a 9.3% increase. However, gross profit % declined 190 basis points, from 44.6% to 42.7%. This decrease was due primarily to changes in product/service revenue, greater volatility in the timing of monthly and quarterly production volumes, and an increase in installations revenue which typically results in lower gross profit than our standard manufacturing process. Installation revenue contributed an estimated 100 basis points to the overall decline in the gross profit %. Volatility in manufacturing volumes is evidenced by the decline from the record revenue levels achieved in both the third and fourth quarters of 2016 ($71.5 million and $78.3 million, respectively) to the seasonally lower results achieved in the first and second quarter of the current year.
Adjusted gross profit for Q2 2017 improved by 8.8%, from $28.2 million in Q2 2016 to $30.7 million in Q2 2017. However, adjusted gross profit % declined 220 basis points, from 46.1% to 43.9%, for the same reasons discussed above with respect to gross profit.
The impact of the higher US dollar to Canadian dollar average exchange rate (Q2 2017 - 1.3449; Q2 2016 - 1.2882) contributed to the increased gross profit and adjusted gross profit in Q2 2017 compared with Q2 2016.
Gross profit increased from $51.4 million in YTD 2016 to $56.9 million in YTD 2017, a 10.6% increase. However, YTD gross profit % declined 180 basis points, from 43.9% to 42.1%. This decrease was due primarily to changes in product/service revenue, greater volatility in the timing of monthly and quarterly production volumes, and an increase in installations revenue which typically results in lower gross profit than our standard manufacturing process. Adjusted gross profit for YTD 2017 improved by 10.4%, from $53.0 million in YTD 2016 to $58.6 million in YTD 2017. However, adjusted gross profit % declined 190 basis points, from 45.3% to 43.4%, for the same reasons discussed above with respect to gross profit.
SG&A Expenses / Adjusted SG&A Expenses / SG&A % / Adjusted SG&A %
SG&A % increased by 200 basis points from 45.0% to 47.0% in Q2 2017 compared with Q2 2016. SG&A expenses increased by $5.4 million, or 19.5%, for Q2 2017 compared with Q2 2016. The increase reflects DIRTT's accelerated investment in long-term growth initiatives that were incurred in 2017. The most significant change can be attributed directly to sales-related efforts, as salaries and commissions increased by $2.6 million. These costs reflect the addition of personnel to generate and support higher business volumes, and commissions on the higher revenues attained in the period. DIRTT has also added additional team members to work specifically on projects for the previously discussed major customer. Included in the increase of $2.6 million is $0.8 million related to severance and restructuring costs incurred during Q2 2017. Other increases in SG&A in Q2 2017 included travel and marketing costs of $1.8 million, depreciation and amortization expense of non-manufacturing-related assets of $0.8 million, rent expense of $0.2 million, and $0.6 million in other operating expense items. These increases were offset by a decrease in stock-based compensation of $0.2 million and professional service fees of $0.4 million. The increase in depreciation and amortization expense of non-manufacturing-related assets correlates with our increased investment in our software and product development.
Included in SG&A costs for Q2 2017 and Q2 2016 is $3.5 million and $3.4 million, respectively, directly related to DIRTT Connext.
Adjusted SG&A % increased by 190 basis points from 38.5% to 40.4% in Q2 2017 compared with Q2 2016. Adjusted SG&A expenses increased by $4.7 million, or 20.1%, for Q2 2017 compared with Q2 2016. The cause of this increase is as discussed above with respect to SG&A, excluding the impact from increased non-cash depreciation and amortization of non-manufacturing-related assets and decreased stock-based compensation expenses incurred in the period.
SG&A % increased by 180 basis points from 43.3% to 45.1% in YTD 2017 compared with YTD 2016. SG&A expenses increased by $10.2 million, or 20.2%, for YTD 2017 compared with YTD 2016. This increase reflects DIRTT's improved operating results in the period and ongoing investment in long-term growth initiatives. The most significant change can be attributed directly to sales-related efforts, as salaries and commissions increased by $5.5 million. These costs reflect the addition of personnel to generate and support higher business volumes, and commissions on the higher revenues attained in the period. Included in the increase of $5.5 million is $0.9 million related to severance and restructuring costs incurred during YTD 2017. Other increases in SG&A in YTD 2017 included travel and marketing costs of $2.2 million, depreciation and amortization expense of non-manufacturing-related assets of $1.5 million, rent expense of $0.4 million, and $1.1 million in other operating expense items. These increases were offset by a decrease in stock-based compensation of $0.3 million and professional service fees of $0.2 million. The increase in depreciation and amortization expense of non-manufacturing-related assets correlates with the increase in our investment in software and product development.
Adjusted SG&A % increased by 190 basis points from 36.5% to 38.4% in YTD 2017 compared with YTD 2016. Adjusted SG&A expenses increased by $9.1 million, or 21.2%, for YTD 2017 compared with YTD 2016. The reason for the increase is the same as discussed above with respect to SG&A, excluding the impact from increased non-cash depreciation and amortization of non-manufacturing-related assets and decreased stock-based compensation expense incurred in the period.
The impact of the higher US dollar to Canadian dollar average exchange rates during the three and six-month periods ended June 30, 2017 contributed to the overall increase in SG&A and adjusted SG&A expenses across the organization, as certain of these SG&A expenditures are denominated in US dollars.
Adjusted EBITDA / Adjusted EBITDA %
Adjusted EBITDA decreased $2.2 million for Q2 2017 compared with Q2 2016. Adjusted EBITDA % for Q2 2017 declined 420 basis points from 7.2% in Q2 2016 to 3.0% in Q2 2017. The decrease in Q2 2017 was mainly due to higher adjusted SG&A expenses of $4.7 million and partially offset by higher adjusted gross profit of $2.5 million. Adjusted EBITDA decreased $2.8 million for YTD 2017 compared with YTD 2016. Adjusted EBITDA % for YTD 2017 declined 310 basis points from 7.6% in YTD 2016 to 4.5% in YTD 2017. The decrease in YTD 2017 was mainly due to higher adjusted SG&A expenses of $9.1 million, partially offset by higher adjusted gross profit of $5.5 million and a decrease in foreign exchange loss of $0.7 million.
Foreign exchange ("FX") gains or losses are primarily the result of the period-end revaluation of monetary assets and liabilities held within our Canadian companies, the largest components of which are holdings of US dollar cash and cash equivalents and long-term debt. The decrease in foreign exchange loss of $0.7 million is the result of significant fluctuations in the CAD-USD exchange rate in the year-over-year periods. During Q2 2016, the US dollar decreased by $0.09 compared to year-end 2015, resulting in a $1.3 million loss on the revaluation of these monetary assets and liabilities. Conversely, the US dollar depreciated during Q2 2017 by $0.04 compared to year-end 2016, resulting in a $0.6 million loss being recognized. These amounts exclude any gains or losses resulting from the revaluation of our US dollar- denominated long-term debt, as these amounts have been re-added in the determination of Adjusted EBITDA, as per reconciliation below.
| Q2 | Q2 | Q2 YTD | Q2 YTD | |||
| ($ thousands) | 2017 | 2016 | Variance | 2017 | 2016 | Variance |
| FX loss as reported | 38 | 341 | (303) | 93 | 1,006 | (913) |
| FX (gain) loss on debt revaluation | (266) | 11 | (277) | (499) | (306) | (193) |
| FX loss included in Adjusted EBITDA | 304 | 330 | (26) | 592 | 1,312 | (720) |
Outlook
We believe the cost-effective experience and multiple efficiencies created with DIRTT Solutions result in a superior alternative to conventional construction, across all sectors of the construction industry. We expect ongoing pursuit of further opportunities in the healthcare, education, government, corporate and residential sectors, and we expect to see rising global construction activity result in increased revenue. Revenue growth is monitored as a key metric in the evaluation of our long-term business growth strategy, which is comprised of five core initiatives, as follows:
| (1) | Increase penetration of existing markets. We maintain increased investment in programs that support our existing sales Partners throughout North America and international markets. This includes our previously announced programs to support our top-tier Partners and develop our next-tier Partners for increased market penetration and higher profitability, our DIRTT Green Learning Center loan program, and increasing investment in the research and development of product innovations and ICE software to support market-specific solutions. Collectively, we believe these are contributing factors to the momentum we are seeing as we enter the latter half of the year. |
| (2) | Expand into new geographies, such as the Middle East, India, Southeast Asia, United Kingdom and Europe. DIRTT's first international Partner, NMG Workplace Solutions, maintains significant investment into their business as they identify and secure healthcare opportunities throughout the Middle East region. Healthcare offers immense potential within the Middle East and NMG has recently secured several important projects within that market. We expect continued growth in that region with NMG. External to North America and the Middle East, DIRTT continues its international expansion with investment in the following: the June 2017 addition of a Partner in the United Kingdom, Architectural Wallsz, alongside our DIRTT-owned Green Learning Center in London; our Partner in Singapore, ITS Group; and our Partner in India, Shreeji Innova. Escalating construction costs, labor challenges, increasing demand for high-quality materials and timeline pressures present further opportunities for strategic international expansion and long-term growth. |
| (3) | Target and penetrate new industry verticals. We intend continued investment as we progress further into new markets including residential and create solutions tailored to that market, such as the Leaf™ sustainable folding wall, which now supports integrated technologies within the wall; and continued development of timber frame construction. |
| (4) | Accelerate investment in new solutions and technologies. Throughout the remainder of 2017, we expect continued investment in product and software development to further expand our solution offerings, as well as in certain manufacturing equipment to support these developments. We also plan to continue investment in our existing GLCs to ensure each location represents DIRTT accurately with the latest innovations. We believe our software innovations, such as ICEreality™ and ICE's recently unveiled experience that allows multiple people to explore a space in mixed reality in real-time and from separate locations-will change the way people design, create, collaborate and build interiors. |
| (5) | Build and maintain strategic partnerships with industry leaders to monetize solutions, with continued investment resulting in partnerships such as, for example, this year's integration of ICE software with SAP's enterprise resource planning system. |
We believe the investment our Partners are making in our business, such as increased investment in Green Learning Centers and higher attendance at DIRTT Connext, are collectively indicative of long-term prospects for our business.
Approximately 80% to 85% of DIRTT's revenue is denominated in US dollars, and the US dollar weakened significantly against the Canadian dollar in the time periods leading up to and subsequent to quarter end. To offset the potential for resulting volatility, DIRTT maintains significant US-based operations; approximately 45% to 50% of costs remain based in US dollars.
Liquidity and Capital Resources
At June 30, 2017, we had $77.9 million in cash and cash equivalents compared with $93.6 million at December 31, 2016. At June 30, 2017, we also had access to an undrawn US$18.0 million revolving credit facility.
Non-IFRS Measures
Adjusted gross profit, Adjusted gross profit %, Adjusted SG&A, Adjusted SG&A %, Adjusted EBITDA, Adjusted EBITDA % and cash provided by operating activities before changes in non-cash working capital are non-IFRS measures. Non-IFRS measures do not have a standard meaning as prescribed by IFRS, and are therefore unlikely to be comparable to similar measures presented and calculated by other companies. DIRTT believes the non-IFRS measures are useful supplemental measures that may assist investors in assessing DIRTT's business. The non-IFRS measures should not be considered as the sole measure of the Company's performance and should not be considered in isolation from, or as a substitute for, analysis of its financial statements. For a reconciliation of these non-IFRS measures as well as the rationale for management's use of such measures, see the Company's management's discussion and analysis for the three and six-month periods ended June 30, 2017, available at http://www.sedar.com.
Conference Call Details
DIRTT Chief Executive Officer Mogens Smed, with DIRTT President and Interim Chief Financial Officer Scott Jenkins, will host a conference call and webcast for the investment community on Thursday, August 3, 2017 at 9 a.m. ET (7 a.m. MT) to discuss the second quarter results in greater detail.
To access the conference call by telephone, dial +1 877.479.7708 (toll-free in North America). Please call 10 minutes prior to the start of the call. In addition, a live webcast (listen only mode) of the conference call will be available at http://edge.media-server.com/m/p/aikuojsi.
Investors are invited to submit questions by email before and during the conference call. Please send them to ir@dirtt.net. A replay of the conference call will be available at +1 855.859.2056 by entering the passcode 60139898, from noon (ET) Thursday, August 3, 2017 to midnight (ET) Thursday, August 10, 2017 at http://edge.media-server.com/m/p/aikuojsi, or on DIRTT's website at www.dirtt.net/company/investor.
About DIRTT / www.DIRTT.net
DIRTT Environmental Solutions (Doing it Right This Time) uses its proprietary 3D software to design, manufacture and install fully customized, prefabricated interiors. The Company's customers in the corporate, government, education and healthcare sectors benefit from DIRTT's precise design and costing; rapid lead times with the highest levels of customization and flexibility; and faster, cleaner construction. DIRTT's manufacturing facilities are in Phoenix, Savannah, Kelowna and Calgary. DIRTT's team supports nearly 100 Partners throughout North America, the United Kingdom, the Middle East and Asia. DIRTT trades on the Toronto Stock Exchange under the symbol "DRT."
Forward-Looking Statements
Certain information and statements contained in this news release constitute "forward-looking information" and "forward- looking statements" (collectively, "Forward-Looking Information") as defined under applicable Canadian securities laws and the Company hereby cautions investors about important factors that could cause the Company's actual results or outcomes to differ materially from those projected in any Forward-Looking Information contained in this news release. Any statements that express, or involve discussions as to, expectations, beliefs, plans, objectives, assumptions or future events or performance (often, but not always, through the use of words or phrases such as "will likely result", "are expected to", "will continue", "is anticipated", "believes", "estimated", "intends", "plans", "projection" and "outlook"), are not historical facts and may be forward-looking and may involve estimates, assumptions and uncertainties which could cause actual results or outcomes to differ materially from those expressed in such Forward-Looking Information.
In particular and without limitation, this news release contains Forward-Looking Information pertaining to the following: comments with respect to the Company's revenue, objectives and priorities for 2017 and beyond; project timetables; its growth strategies and opportunities; its ability to meet working capital requirements and financial obligations; use and deployment of the Company's capital; and its outlook for its operations and the Canadian, US and international economies, and in particular, the US and Canadian construction industry.
With respect to Forward-Looking Information contained in this news release, assumptions have been made regarding the Company, among other things:
- its ability to manage its growth;
- competition in its industry;
- its ability to enhance current products and develop and introduce new products;
- its ability to obtain components and products from suppliers on a timely basis and on favorable terms;
- its ability to obtain qualified staff and equipment in a timely and cost-efficient manner;
- the regulatory framework governing taxes in Canada and the US and any other jurisdictions in which the Company currently or may conduct its business in the future;
- future development plans for its assets unfolding as currently envisioned;
- future capital expenditures to be made by the Company;
- future sources of funding for its capital program;
- the impact of increasing competition on the Company; and
- its success in identifying risks to its business and managing the risks mentioned below.
The Company's actual results or outcomes could differ materially from those expressed in the Forward-Looking Information as a result of the risks normally encountered in its industry such as:
- maintaining and managing growth;
- history of losses;
- risks related to new technology;
- competition risks;
- operating results and financial condition fluctuations on a quarterly and annual basis;
- risks related to intellectual property;
- risks related to additional capital requirements;
- customer base and market acceptance;
- software and product defects and design risks;
- availability of key supplies;
- dependence on key personnel;
- commodity price risk;
- credit risk;
- the effect of government regulation;
- risks related to international expansion;
- risks related to physical facilities;
- legal risks;
- foreign currency and fiscal matters;
- risks related to future acquisitions;
- risks related to Forward-Looking Information;
- reliance on third parties; and
- conflicts of interest.
Since actual results or outcomes could differ materially from those expressed in the Forward-Looking Information provided by or on behalf of the Company, investors and others should not place undue reliance on any such Forward- Looking Information.
DIRTT cautions that the foregoing lists of factors are not exhaustive. Further, Forward-Looking Information is made as of the date hereof, and the Company undertakes no obligation to update Forward-Looking Information to reflect events or circumstances after the date on which such statement is made or to reflect the occurrence of unanticipated events, except as required by applicable Canadian securities laws. New factors emerge from time to time, and it is not possible for DIRTT's management to predict all of these factors and to assess in advance the impact of each such factor on the Company's business or the extent to which any factor, or combination of factors, may cause actual results to differ materially from those contained in Forward-Looking Information. No assurance can be given that these expectations will prove to be correct and such Forward-Looking Information contained in this news release should not be unduly relied upon. In addition, this news release may contain Forward-Looking Information attributed to third party industry sources.
For a detailed description of the risks and uncertainties facing the Company and its business and affairs, readers should refer to the Company's annual financial statements, management's discussion and analysis and annual information form for the year ended December 31, 2016, all of which are available at http://www.sedar.com.
Market and Industry Data
Certain market and industry data contained in this news release is based upon information from government or other third-party publications, reports and websites or based on estimates derived from such publications, reports and websites. Government and other third-party publications and reports do not guarantee the accuracy or completeness of their information. While the Company believes this data to be reliable, market and industry data is subject to variations and cannot be verified with complete certainty due to limits on the availability and reliability of raw data, the voluntary nature of the data-gathering process and other limitations and uncertainties inherent in any statistical survey.
Contact Information:
President and Interim Chief Financial Officer
DIRTT
sjenkins@dirtt.net
403.723.5009
Kim MacEachern
Investor Relations
DIRTT
kmaceachern@dirtt.net
403.618.4539